
Best Practices for Data Modeling in Financial Due Diligence
A well-structured databook is crucial in financial due diligence, as it forms the foundation for preparing accurate numbers before drafting the report, ensuring efficiency and minimizing errors throughout the process.
This post covers key best practices for structuring a databook, drawing from the experiences of advisors in the field. It will explore various approaches to databook organization and highlight fundamental practices that are critical, no matter which method is adopted. The content is designed for both analysts just starting in FDD and more experienced professionals, offering insights that enhance consistency and streamline processes across all levels.
Table of Contents
- Introduction
- Key Elements of a Financial Due Diligence Report
- The Role of a Databook in Financial Due Diligence
- Efficient Setup - Using Templates and Macros
- Essential Preparations Before Crunching Numbers
- Reconciliations - Ensuring Data Integrity
- Best Practices for Data Structuring and Organization
- Starting Point and Key Considerations
- Conclusion
Introduction
The team behind Accelerate Excel has extensive experience in transaction advisory and financial modelling, having faced the challenges of managing client requests, tight deadlines, and disorganized datasets. This expertise has fostered a deep understanding of Excel and its potential to streamline workflows. However, repetitive, manual tasks often consume valuable time that could be better spent on critical aspects of the deal process.
This realization led to the creation of Accelerate, a tool designed to automate these tasks and enable professionals to focus on the most important parts of their work without being slowed down by Excel.
In addition to developing Accelerate Excel, the team has established best practices for crafting well-structured databooks to simplify the due diligence process. This article shares these insights, covering topics such as hierarchical data organization, effective naming conventions, and more.
Key Elements of a Financial Due Diligence Report
Although each financial due diligence report is unique due to the distinctiveness of each target company and the specific deal mechanisms and background, there are a few fundamental components that are consistently included in these reports. These core building blocks typically encompass:
Profit and Loss Statement (P&L): This section presents the company's financial performance, reported and adjusted for any one-off effects through a Quality of Earnings (QoE) analysis.
Net Debt (ND): This represents the company's financial position, calculated as Cash minus any liabilities.
Net Working Capital Analysis(NWC): This analysis demonstrates the company's operational efficiency by examining its current assets and liabilities.
Detailed Breakdown:
1. Profit and Loss Statement (P&L):
Reported P&L: The standard financial performance of the company.
Adjusted P&L: Adjustments made for any non-recurring or one-off items to provide a clearer picture of sustainable earnings, often identified through a Quality of Earnings (QoE) analysis.
2. Net Debt:
Cash: Total cash reserves held by the company.
Liabilities: Total financial obligations including short-term and long-term debts.
Net Debt Calculation: Cash minus liabilities to determine the company's net debt position, is crucial for understanding its financial health.
3. Net Working Capital Analysis:
Current Assets: Includes items such as accounts receivable, inventory, and other short-term assets.
Current Liabilities: Includes items such as accounts payable and other short-term liabilities.
Working Capital Calculation: Current assets minus current liabilities, providing insight into the company’s operational liquidity and efficiency.
By including these essential components, financial due diligence reports offer a comprehensive view of a company's financial health, ensuring informed decision-making in the transaction process.
Most reports are primarily written in PowerPoint and can vary widely in size. However, the tables and detailed financial data within these reports are typically prepared in Excel, where a databook acts as the backbone of each report.
The Role of a Databook in Financial Due Diligence
A databook is a comprehensive compilation of financial data, analyses, and supporting documentation that serves as the foundation for financial due diligence reports. It is typically created in Microsoft Excel and includes detailed schedules, reconciliations, and adjustments that underpin the key financial statements and metrics presented in the due diligence report.
The databook ensures that all data is organized, traceable, and readily accessible for analysis, facilitating accuracy and consistency throughout the due diligence process. By maintaining a well-structured databook, financial consultants can efficiently manage large volumes of data, perform in-depth analyses, and provide clear, data-driven insights to inform transaction decisions.
For most people in the industry, it's clear what I mean by a financial databook, but since this article also serves as an introduction for newcomers, let's clarify:
A financial databook, in the context of financial due diligence, is the holy grail of numbers. Every figure you see in a due diligence report once originated as a table in a databook. Databooks are typically the foundation of every project, containing all essential financial information such as balance sheets, income statements, and cash flow statements. Additionally, the databook will likely be provided alongside the report to potential buyers in a transaction, published in a Virtual Data Room (VDR), or serve as crucial input for purchase price calculations and financial modelling.
Efficient Setup - Using Templates and Macros
Creating a new databook from scratch can be time-consuming and prone to errors. To fast-track this process, leveraging templates and macros can significantly reduce manual effort and enhance accuracy.
Templates
While setting up templates requires an upfront investment of time, they can be reused across multiple projects, providing a consistent and standardized starting point. Templates save time and ensure a uniform format, but some manual adjustments may still be necessary to address the unique requirements of each project.
Macros and Automation Tools
Many advisory firms have developed proprietary tools and macros to simplify the initial setup of a databook. These tools allow users to input basic project details, such as currency, financial period, and project name. Based on this input, the tool generates a tailored template, complete with standardized formats and predefined structures. This automated approach not only minimizes setup time but also reduces the risk of errors, ensuring consistency and efficiency from the outset.
Essential Preparations Before Crunching Numbers
Before you start filling your databook with numbers, it's crucial to perform or ensure the following steps:
Save Correctly: Store the databook on a reliable and secure server, such as OneDrive or MS Teams, to enable automatic backups and prevent data loss in the event of a crash.
Enable Collaborative Work: If the databook involves multiple contributors, avoid using macros or add-ins, as these can lead to synchronization conflicts in shared environments.
Check for Version Control: Establish a version control system to track changes and maintain different versions of the databook.
Standardize Naming and Formatting: Align essential names and formatting before you begin. This includes agreeing on currency tags (e.g., EURk, EUR’000, EUR000) and naming conventions (e.g., EBITDA vs. Reported EBITDA).
Outline a Clear Structure:
Define a logical layout for the databook, including P&L, balance sheet, and working capital sections. This structure will guide data organisation and make navigation easier during analysis and reporting.
Reconciliations - Ensuring Data Integrity
Once you have the data to build your databook, the first critical step is reconciling it with the audited financial statements. Starting your work without ensuring alignment can lead to significant inefficiencies, such as setting up a P&L only to discover it doesn’t match the audited figures.
Discrepancies between source data and audited financials can arise for various reasons, including:
Different Accounting Standards: Differences in accounting standards (e.g., IFRS, US GAAP) can lead to variations in how financials are reported.
Internal vs. External Reporting: Companies may use different methods for internal management reporting compared to external financial reporting, leading to discrepancies.
Timing Differences: The timing of recognizing revenues and expenses can differ between internal records and audited financials.
Estimates and Judgments: Variations in estimates and judgments used in accounting (e.g., provisions, depreciation) can cause differences.
Adjustments and Reclassifications: Manual adjustments or reclassifications made during the preparation of audited financials might not be reflected in the initial data.
Building a reconciliation bridge to understand and resolve these differences is essential. This process includes verifying discrepancies with management or accountants and making any necessary top-side adjustments. Aligning your databook with audited financials ensures accuracy and sets a reliable foundation for further analysis.
Sample Reconciliation:

Best Practices for Data Structuring and Organization
Once your data is reconciled, you can begin structuring and organizing your data. There are different approaches to structuring it, such as using a flat file, data model, or SUMIFS. You can learn more about when to use each approach in this article. Regardless of the chosen method, certain best practices apply universally to handling, analyzing, and structuring data.
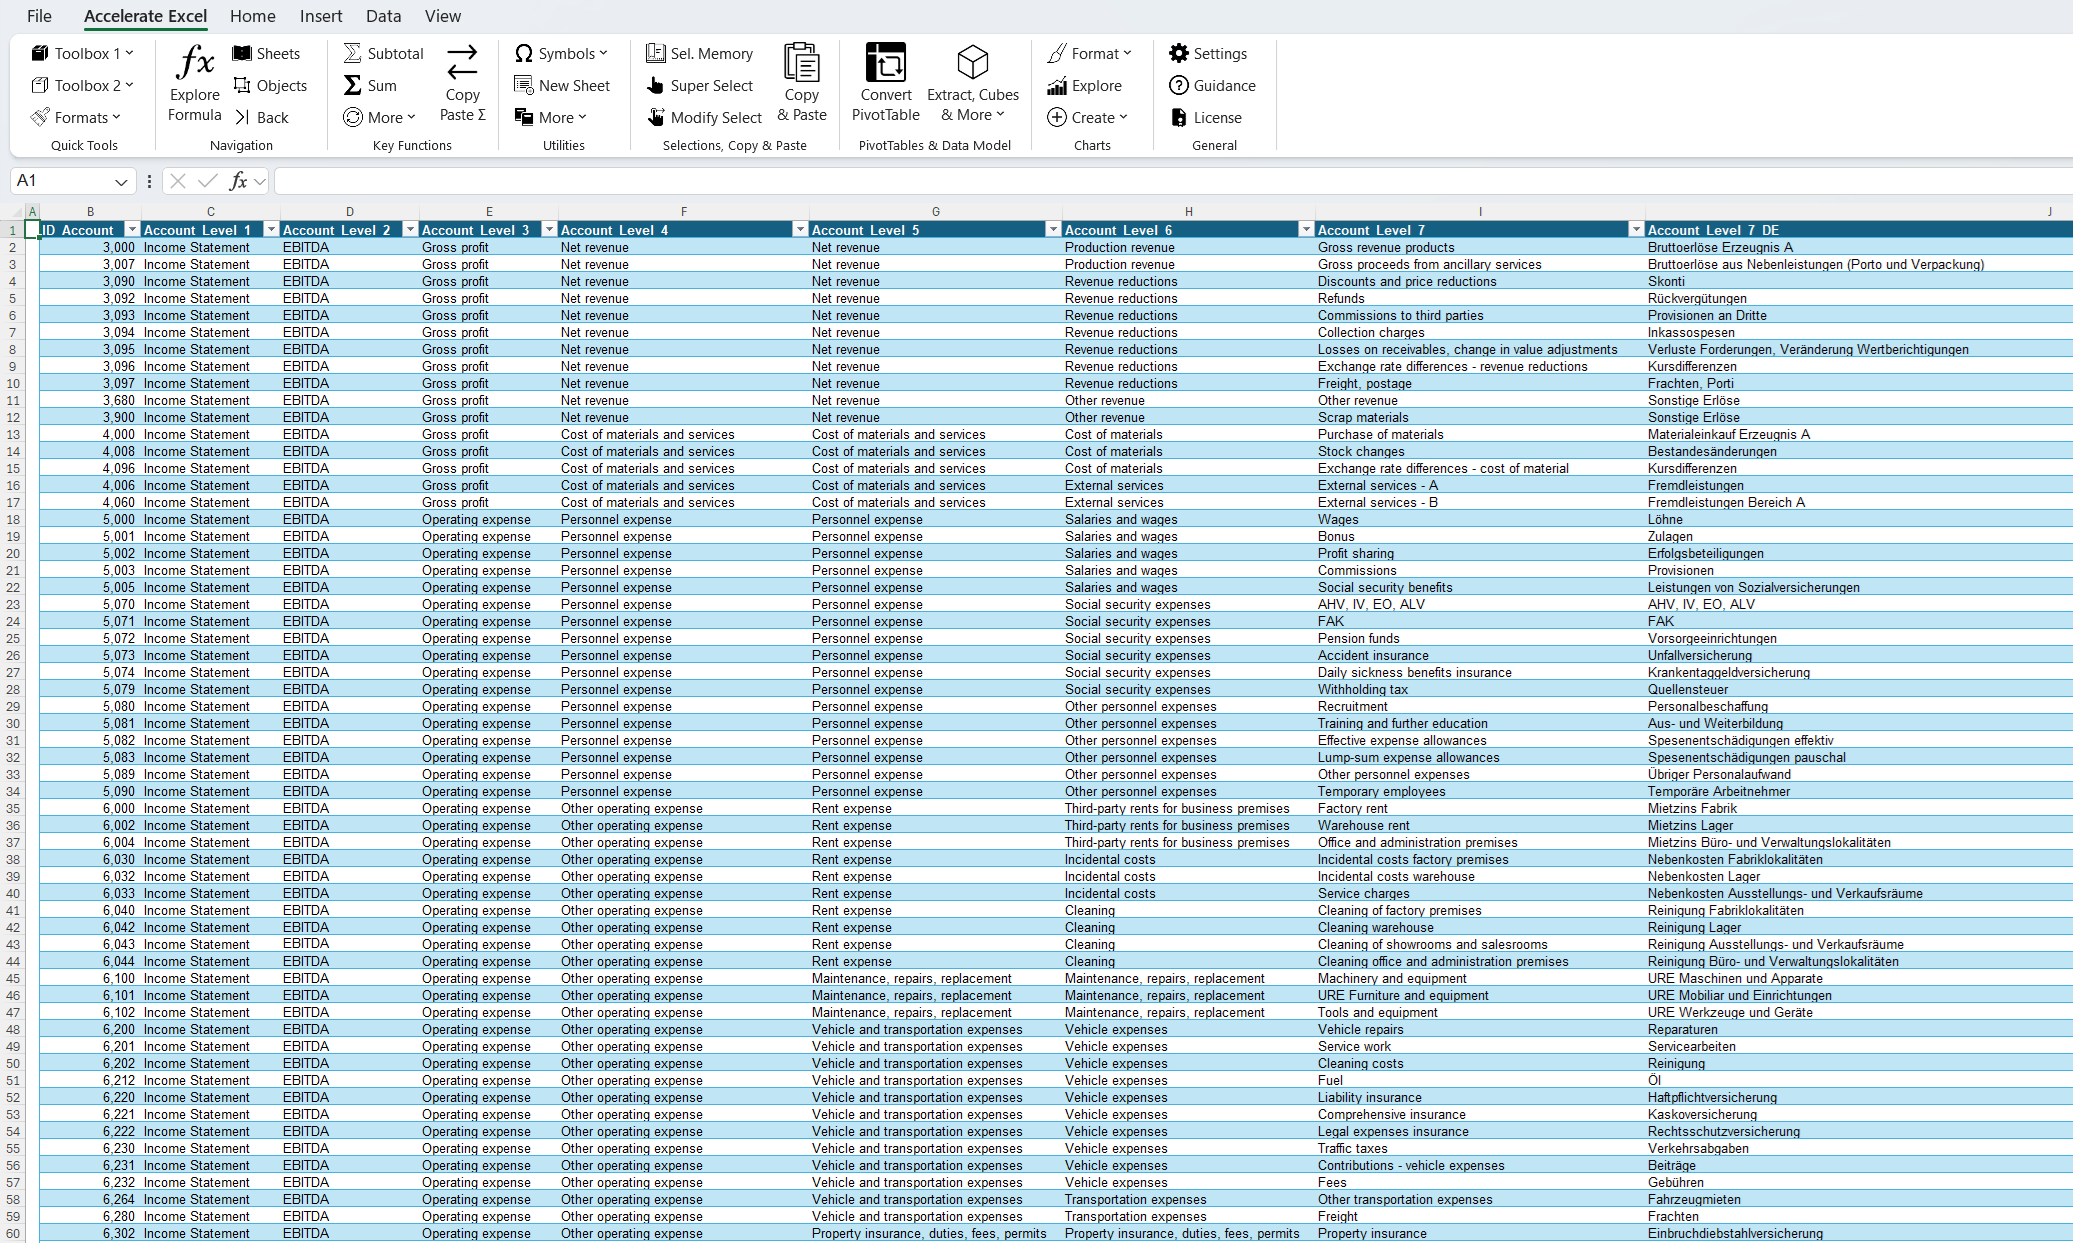
Account Mapping File
Set up an account mapping file that includes account-level information and a well-structured flat file for values. This not only helps you understand the nature of the business by examining account names but also facilitates updates by allowing you to check for new accounts easily. The mapping file typically includes a unique identifier, such as the account number (ID_ACCOUNT).
Naming Conventions
Consistent naming conventions across projects enhance clarity and efficiency. Key items should have standardized names, such as:
ID_LEGAL_ENTITY for legal entity name
ID_DATE for dates
ID_VALUES for any value column containing numbers
ID_ACCOUNT_1, ID_ACCOUNT_2, etc., for account hierarchy
Establishing and adhering to such naming conventions across the team helps everyone understand the columns directly and reduces confusion.
Source Labeling
Label relevant sources in the workbook. Add links or references (e.g., VDR 2.3.4.11) in the source file or include the file name. Especially on larger projects, ensuring data traceability is crucial, as it allows you to always find the source file used and verify the data.
By adhering to these guidelines, you will have a clear, structured dataset that is consistent across projects and ready for analysis. This structured approach not only streamlines the process but also enhances data accuracy and team collaboration.
Sample Mapping File:
Starting Point and Key Considerations
When building your databook, it's best to begin with the group Profit and Loss (P&L) statement. This is because many subsequent analyses, such as Quality of Earnings (QoE) and Key Performance Indicators (KPIs) for Net Working Capital (NWC), rely on the P&L. However, depending on the specifics of your project, starting elsewhere might be more appropriate.
It's equally important to properly name sheets and cells within your workbook. Labeling sections like "Income Statement," "Group & P&L," and the relevant fiscal years (e.g., FY21-FY23) at the outset helps to prevent confusion and keeps everything organized. This simple step ensures your databook is structured correctly, saving time later and minimizing the need for manual cleanup.

Work Faster with Accelerate Excel
Simplify your Excel work with the Accelerate ribbon comprising productivity tools for M&A Transaction/Deal Advisory, FDD and other Excel power users.
Conclusion
Incorporating these best practices into your databook preparation will significantly improve its quality, accuracy, and usability. Starting with the P&L statement, maintaining consistent naming conventions, and labelling sheets are foundational steps that ensure your databook is efficient, well-structured, and client-ready.
For professionals looking to streamline their financial due diligence processes further, Accelerate Excel offers a range of tools specifically designed to simplify everyday FDD tasks. From automating repetitive tasks to enhancing data accuracy and consistency, these functionalities save valuable time and reduce the risk of errors. By combining sound preparation techniques with powerful tools like Accelerate Excel, you can focus on delivering high-quality insights and value in every transaction.