Excel CUBE Functions: A Must-Know for Data-Heavy Consulting Projects
Excel CUBE functions, like CUBEVALUE and CUBEMEMBER, might just be some of the most underappreciated yet powerful tools in Excel’s arsenal. These formulas offer capabilities that extend far beyond what SUMIFS and Vlookups can achieve, and the best part? They’re surprisingly easy to master.
In this article, we'll explore the unique advantages of CUBE formulas, break down how they work and provide a quick tutorial to help you start using them today.
Table of Contents
Dynamic Data Manipulation
Slice and dice your data like a PivotTable, but without the constraints. By integrating PivotTable filters or Pivot slicers into your formulas, you can create dynamic breakdowns, analyses as well as sophisticated dashboards.
Need to switch between normalized and reported view or focus on a specific entity? No problem!
Single Source of Truth
Reduce errors by pulling data from the same place, i.e., an OLAP cube/Data Model, ensuring consistency and accuracy.
Easy Updates
When your data source updates, simply refresh the Data Model. All connected analyses update automatically, saving you time and effort.
Integration with PowerQuery
Load, transform, and clean your data with PowerQuery. Then add CUBE formulas connected to your PowerQuery output, creating a seamless connection between data preparation and analysis. Learn more: Excel Power Query: Combine Multiple Excel Files (2025 Guide).
Integration with PowerPivot
Values from the cube or Data Model can be displayed in a PivotTable, enabling dynamic and flexible data exploration. Once the desired structure is achieved, the PivotTable can be converted into standard Excel formulas. This capability is a significant advantage for consultants, as it overcomes the limited customization options of PivotTables, which are often unsuitable for client deliverables.
Better than GetPivotData
Excel’s CUBE formulas eliminate the need for GetPivotData formulas. The CUBE formulas link directly to your dataset, avoiding the necessity of an intermediary PivotTable.
The two key functions are CUBEVALUE and CUBEMEMBER. Together, they offer a more advanced and flexible alternative to the SUMIFS formula.
The CUBEVALUE function shows aggregated values retrieved from the Data Model / OLAP cube.
The syntax is:
=CUBEVALUE(connection, member_expression1, [member_expression2], …).The CUBEMEMBER function specifies the context for the CUBEVALUE formula, defining what should be aggregated or calculated. Think of it as setting a condition or filter. Technically, the CUBEMEMBER function returns a "Member" that identifies specific elements within the cube's structure, such as a date, account number, or account hierarchy. Additionally, it can define "Measures," which determine the aggregation logic, often a straightforward calculation like a SUM.
The syntax is
=CUBEMEMBER(connection, member_expression, [caption]).
Note: While you can include CUBEMEMBER formulas directly in the CUBEVALUE formula, it is usually easier to manage and adjust formulas if you break down the arguments into different cells and then reference those cells in the CUBEVALUE function.
An Example from Financial Due Diligence (FDD) / Transaction Advisory Services (TAS)
The CUBEVALUE formula is linked to cells containing filter and aggregation arguments
In cell F10, we use the following formula:
Let’s break it down:
"ThisWorkbookDataModel": This part refers to the connection.
Not important, as this is always the same in Excel’s Data Model.
C7:
=CUBEMEMBER("ThisWorkbookDataModel","[Measures].[Sum of VALUES]")This measure instructs the CUBEVALUE to aggregate by summing the values in the VALUES column of the Data Model.
D5: PivotTable filter
Filter to distinguish between reported numbers and adjustments (values for TYPE), such as Quality of Earnings normalizations. The slicers to the left are linked to the PivotTable filters and allow easy switching between different views.
D4: PivotTable filter
Filter for different business entities (values for ID_ENTITY).
E10:
=CUBEMEMBER("ThisWorkbookDataModel","[Account Mapping].[ID_Account].&[3000]")This formula retrieves the member "[3000]" from the "[ID_Account]" column within the "Account Mapping" dimension, instructing the CUBEVALUE to display values for account number 3000.
F9:
=CUBEMEMBER("ThisWorkbookDataModel","[VALUES].[FINANCIAL_YEAR].&[FY21]")This formula retrieves the member "FY21" from the "FINANCIAL_YEAR" column within the "VALUES" source table, instructing the CUBEVALUE to display values for the year 2021.
We use the N() function here to ensure numeric values, so that CUBEVALUE functions resulting in blank or empty cells return zeros.
Step 1: Prepare Your Source Data
Ensure your data is in a flat file structure. A flat file structure comprises multiple columns, a header row with field names, and data records in the rows below the header row.
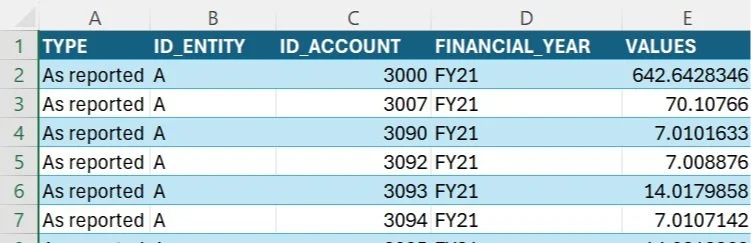
Example of Source Data in Flat File Structure
Step 2: Load Your Source Data into Excel’s Data Model
Go to the ribbon Data > From Table/Range.
Click Close & Load > Close & Load To.
In the Import Data window, select Only Create Connection and Add this data to the Data Model.

Example of Source Data in Flat File Structure
Now, your data is added to the Data Model / OLAP cube. This enables you to (i) use PowerPivot, (ii) create PivotTables pulling data from the Data Model, and (iii) use CUBE formulas.
Step 3: Insert a PivotTable Linked to the Data Model (PowerPivot)
Go to the ribbon Insert > PivotTable > From Data Model.
Select New Sheet > Click ‘OK’.
Arrange the PivotTable in the structure you need.
Step 4: Convert to Formulas
Click anywhere on the PivotTable.
Go to the ribbon PivotTable Analyze > Click OLAP Tools > Convert to Formulas > Click ‘OK’.
Note: If you select ‘Convert filters’, the PivotTable’s filter fields are converted as well. This makes it easier to move sheets between workbooks. Moving a sheet with a Data Model-linked PivotTable object to another workbook will duplicate the Data Model, which you typically do not want.
Moving Sheets with Data Model-Linked PivotTable Objects Across Workbooks
When you copy or move sheets containing Data Model-linked PivotTable objects (such as PivotTables, slicers, and PivotCharts) between workbooks, the entire Data Model is duplicated. As a result, the destination workbook will hold a copy of the Data Model, potentially increasing file size and causing synchronization issues.
Note that while cube formulas (e.g., CUBEVALUE, CUBEMEMBER) don’t replicate the Data Model itself, they require the Data Model (along with all referenced parameters) to be present in the destination workbook.
Using Slicers Indirectly
We recommend applying slicers to filter fields rather than embedding slicers directly within the CUBEVALUE function.
Advantage: You can add or remove slicers without adjusting your formulas.
Disadvantage: This approach requires a PivotTable object to manage the filters, which can complicate the process of copying sheets between workbooks (see the previous section).
Changing the Displayed Text of CUBEMEMBER Functions
You can modify the displayed text in CUBEMEMBER formulas by specifying a custom caption as the function's final argument.
For example, a cell with the formula =CUBEMEMBER("ThisWorkbookDataModel", "[Product].[Category].&[1200]") display “1200.”
By adding a custom caption (e.g., “Electronics”) as the last argument, like so: =CUBEMEMBER("ThisWorkbookDataModel", "[Product].[Category].&[1200]", "Electronics"), the cell will display “Electronics” while still referencing Category 1200.
This feature is helpful for quick adjustments, such as changing account names, without modifying the Data Model and refreshing everything.
Isolating the CUBEMEMBER Criterion
Instead of embedding the criterion directly in the CUBEMEMBER function, you can link it to a cell containing the criterion.
For example, change =CUBEMEMBER("ThisWorkbookDataModel", "[Product].[Category].&[1200]") to =CUBEMEMBER("ThisWorkbookDataModel", "[Product].[Category].&[" & C5 & "]"), where cell C5 contains “1200.”
This makes adjustments easier, as you can update the criterion in the linked cell without modifying the full CUBEMEMBER formula.
Dealing with CUBEVALUE Functions Returning Blanks
If the conditions within the CUBEVALUE function do not match any values in your dataset, the function will return an empty or blank cell. This blank cell is interpreted as text by other functions, which can lead to errors.
The simplest solution is to wrap the CUBEVALUE function in the N() function. This forces a numeric data type, effectively replacing blanks with zeros and preventing errors in subsequent calculations.
Accelerate Excel is our premium add-in that puts powerful solutions at your fingertips, eliminating the need for complex VBA coding or other time-consuming workarounds.
When you use Excel’s native Convert to Formulas feature, the converted formulas come without formatting and groupings. Also, all hierarchy levels are converted to CUBE functions, requiring manual addition of SUM or SUBTOTAL functions for higher hierarchy levels.
If you've ever compiled and formatted a detailed P&L or balance sheet, you know the effort involved, especially with multiple granular account hierarchy levels. Accelerate Excel is a game-changer, automating all the formatting work for you. Learn more.
Note: You typically aggregate or lookup at the lowest hierarchy level and use SUM or SUBTOTAL for higher levels to ensure formula integrity.
While CUBE formulas are excellent for internal analysis, sharing workbooks with the Data Model can be problematic:
The Data Model includes all your source data even if it's not displayed on a worksheet. You may not want to share all the data.
It can confuse recipients who aren't familiar with the Data Model.
Accelerate Excel allows you to:
Extract selected sheets without the Data Model, converting all CUBE formulas to values.
Convert CUBE formulas in a selection to values. Learn more.
Replace criteria (e.g., account number) in selected CUBEMEMBER formulas with a cell reference. For instance, change:
=CUBEMEMBER("ThisWorkbookDataModel","[Account Mapping].[ID_Account].&[3000]") to
=CUBEMEMBER("ThisWorkbookDataModel","[Account Mapping].[ID_Account].&["&C5&"]"), where cell C5 contains “3000”.
Isolating the criterion in a separate cell makes adjustments much more efficient.
Replace cell references in selected CUBEMEMBER formulas with explicit criteria (reverse of #1).
Breakdown selected nested CUBEMEMBER functions across multiple cells.
Add an N() function around selected CUBEVALUE formulas to enforce numeric values, showing zeros instead of blanks.
If you’re reading this, you’re probably an Excel pro and tech-savvy. Your first instinct might be to use CUBE formulas everywhere (that was mine back in the day). Resist that urge. While powerful, CUBE formulas may not always be right choice.
When to Use vs. Not Use the CUBE Approach
When to Use
Sell-side projects: Typically longer duration, less tailored analyses (more data dump) due to a broader audience, multiple source data updates.
Multiple slicing and dicing options: By entities, profit/cost centers, business units, etc.
Multiple views analysis: Reported/Adjusted P&L on a granular level.
In situations where you would use GetPivotData. We believe CUBE formulas make GetPivotData obsolete.
When Not to Use
Small projects with little data: For instance, projects with only a few P&L line items or a single entity.
High time pressure and little experience: Avoid using CUBE formulas on tight-deadline projects if you're inexperienced. Instead, practice during downtime by replicating key analyses from past projects using the CUBE approach to build your skills.
DAX Measures in PowerPivot
In the Data Model / PowerPivot tables, you can define how values are calculated. For example:
Create a dynamic KPI such as gross profit margin by specifying that gross profit is divided by net revenue.
Define a lookup that returns the account name based on an account number.
While many experts praise DAX, we generally recommend avoiding DAX measures in typical deals settings due to the short-lived nature of deals projects and the relative complexity of DAX. Most people can understand a KPI calculation based on two cell references, but few know how or where DAX measures are defined. In the fast-paced, collaborative world of M&A deals, simplicity is key.
Common calculations (e.g., dividing by 1,000) can be handled during the data preparation step (e.g., in PowerQuery, Alteryx, etc.) or applied directly in standard worksheet formulas. Aggregation logic (such as the definition that Gross Profit and Operating Expenses are components of EBITDA) is best handled through hierarchy/mapping tables, combined with the rule that income and expenses have opposite signs so that you can consistently apply addition logic.
Why Not Just Use PowerBI?
PowerBI is fantastic but not suited for most projects in M&A transaction services / deals. In our opinion, PowerBI excels in:
Accounting, FP&A, and controlling reports with more static and clearly defined structures.
Longer-running projects (e.g., large sell-sides) with diverse stakeholders, where interactive dashboards are preferred over static PDFs or detailed Excel databooks.
Standardizable analyses where input and output are predictable and too large for Excel, such as bottom-up sales and price/volume analyses.
For most transaction advisory projects, we prefer PowerPivot and CUBE formulas due to their ease and speed of setup, their similarity to SUMIFS (which is widely known and used in the industry), and their customizability. For example, think of applying live changes during client calls to Excel cells compared to a PowerBI dashboard.
CUBE formulas in Excel offer dynamic, powerful data manipulation far beyond what SUMIFs can do. For those in transaction advisory services, they provide greater flexibility, accuracy and easier updates. If you're dealing with complex data or working on sell-side projects, mastering CUBE formulas can significantly enhance your efficiency and insights.
Keywords:
CUBEVALUE, CUBEMEMBER, CUBEMEMBERPROPERTY, CUBESET function, CUBESETCOUNT, CUBERANKEDMEMBER, CUBEKPIMEMBER, Microsoft Excel, Excel Formulas, Excel CUBE formulas, Excel CUBE functions